User david94 uploaded the image
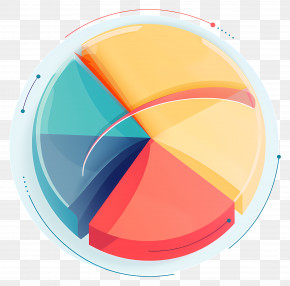
A 3D pie chart that shows the percentage of people who have been diagnosed with cancer. The chart is circular in shape and has six sections, each representing a different percentage. The largest section is blue, the smallest is pink, and the largest is purple. The pie chart is set against a transparent background.
Pie Chart - 3D Blue Pie Chart For Analysis PNG
. The resolution of this PNG file is 3588 x 2528 pixels and it has a file size of 2.86 MB.A 3D pie chart that shows the percentage of people who have been diagnosed with cancer. The chart is circular in shape and has six sections, each representing a different percentage. The largest section is blue, the smallest is pink, and the largest is purple. The pie chart is set against a transparent background.
Related PNG Images