User windoanvn uploaded the image
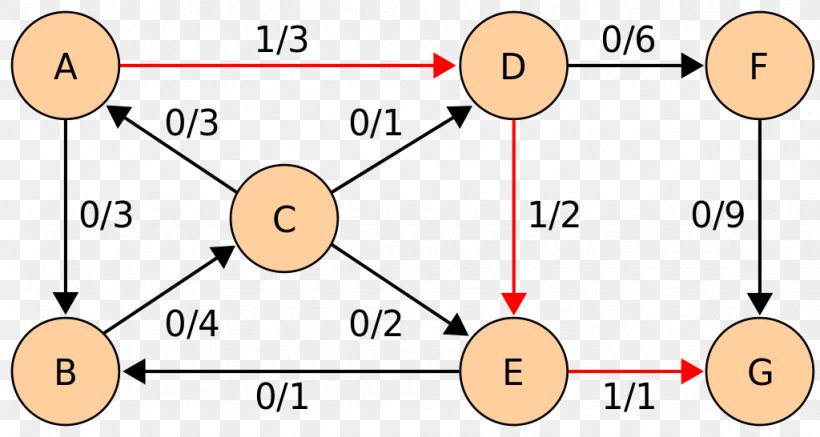
A diagram that shows a network of six circles connected by a red arrow. The circles are labeled A, B, C, D, F, G, and E. The red arrow is pointing towards each circle, indicating the direction of the flow of data between them.
Dinic's Algorithm Graph Theory Maximum Flow Problem PNG
. The resolution of this PNG file is 1024 x 546 pixels and it has a file size of 61.27 KB.A diagram that shows a network of six circles connected by a red arrow. The circles are labeled A, B, C, D, F, G, and E. The red arrow is pointing towards each circle, indicating the direction of the flow of data between them.
Related PNG Images