User gomeslaura uploaded the image
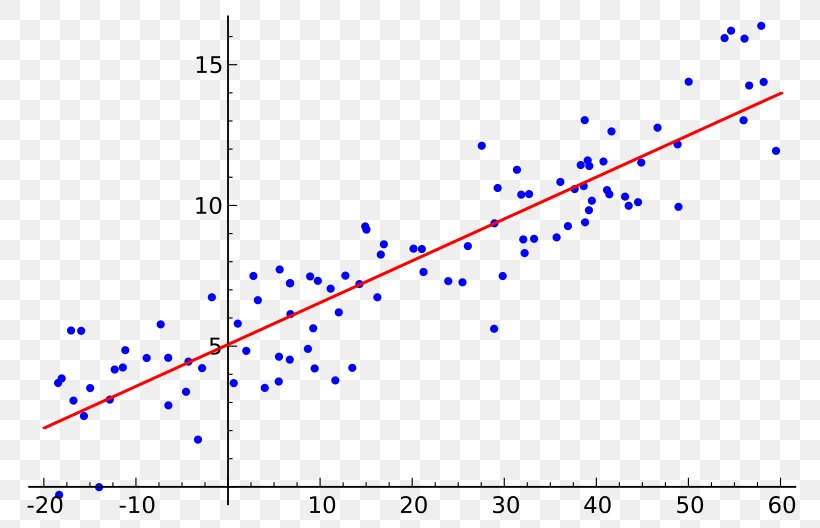
A scatter plot with a red line that is plotted on a transparent background. The x-axis of the plot is represented by small blue dots, while the y-axis is represented as a straight line. The blue dots are scattered across the plot, creating a scatter-like pattern. The red line is slightly higher than the blue dots. The plot appears to be a line graph, with the red line representing the relationship between the two variables.
Regression Analysis Simple Linear Regression Machine Learning Mathematical Model PNG
. The resolution of this PNG file is 800 x 528 pixels and it has a file size of 21.21 KB.A scatter plot with a red line that is plotted on a transparent background. The x-axis of the plot is represented by small blue dots, while the y-axis is represented as a straight line. The blue dots are scattered across the plot, creating a scatter-like pattern. The red line is slightly higher than the blue dots. The plot appears to be a line graph, with the red line representing the relationship between the two variables.
Regression Analysis Simple Linear Regression Machine Learning Mathematical Model PNG
Related PNG Images