User fsdlsdflkjsdf uploaded the image
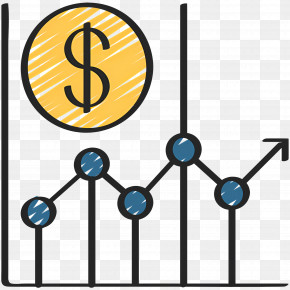
An illustration of a document with a bar graph, a pie chart, and a calculator. The document appears to be a financial report or a financial analysis, as there are several bars of different colors representing different data points. The bar graph is in the center of the document, with the largest bar at the top and the smallest at the bottom. The pie chart is divided into three sections, each with a different color - red, orange, and blue. The calculator is on the right side of the image, with a green speech bubble with a dollar sign on it. On the left side, there is an orange coin with the letter "S" on it, representing the dollar sign.
Stock Market - Financial Report Illustration With Money Symbols PNG
. The resolution of this PNG file is 2048 x 2048 pixels and it has a file size of 1.20 MB.An illustration of a document with a bar graph, a pie chart, and a calculator. The document appears to be a financial report or a financial analysis, as there are several bars of different colors representing different data points. The bar graph is in the center of the document, with the largest bar at the top and the smallest at the bottom. The pie chart is divided into three sections, each with a different color - red, orange, and blue. The calculator is on the right side of the image, with a green speech bubble with a dollar sign on it. On the left side, there is an orange coin with the letter "S" on it, representing the dollar sign.
Stock Market - Financial Report Illustration With Money Symbols PNG
Related PNG Images