User Levithelion uploaded the image
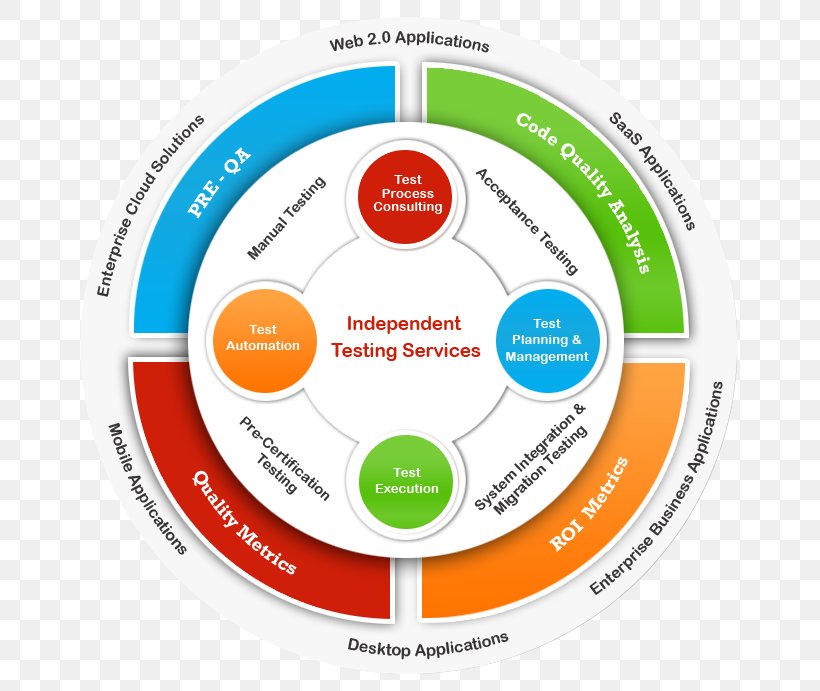
A circular diagram that represents the different types of independent testing services offered by Web 2.0 applications. The diagram is divided into six sections, each representing a different type of testing service. The first section is labeled "Test Automation" and has a red circle in the center. The second section is titled "Test Process Consulting" and is labeled as "Test Planning & Management". The third section is labelled as "Code Quality Analysis". The fourth section has a green circle with a blue circle and a yellow circle. The fifth section has an orange circle with the words "Quality Metrics" and "Test Execution" written on it. The sixth section has two green circles, one labeled "System Integration & Migration Testing" and the other labeled "ROI Metrics". Overall, the diagram is a visual representation of the various testing services available for web applications.
Test Automation Software Testing Continuous Integration Software Development PNG
. The resolution of this PNG file is 690 x 691 pixels and it has a file size of 186.39 KB.A circular diagram that represents the different types of independent testing services offered by Web 2.0 applications. The diagram is divided into six sections, each representing a different type of testing service. The first section is labeled "Test Automation" and has a red circle in the center. The second section is titled "Test Process Consulting" and is labeled as "Test Planning & Management". The third section is labelled as "Code Quality Analysis". The fourth section has a green circle with a blue circle and a yellow circle. The fifth section has an orange circle with the words "Quality Metrics" and "Test Execution" written on it. The sixth section has two green circles, one labeled "System Integration & Migration Testing" and the other labeled "ROI Metrics". Overall, the diagram is a visual representation of the various testing services available for web applications.
Test Automation Software Testing Continuous Integration Software Development PNG
Related PNG Images