User Cheszin uploaded the image
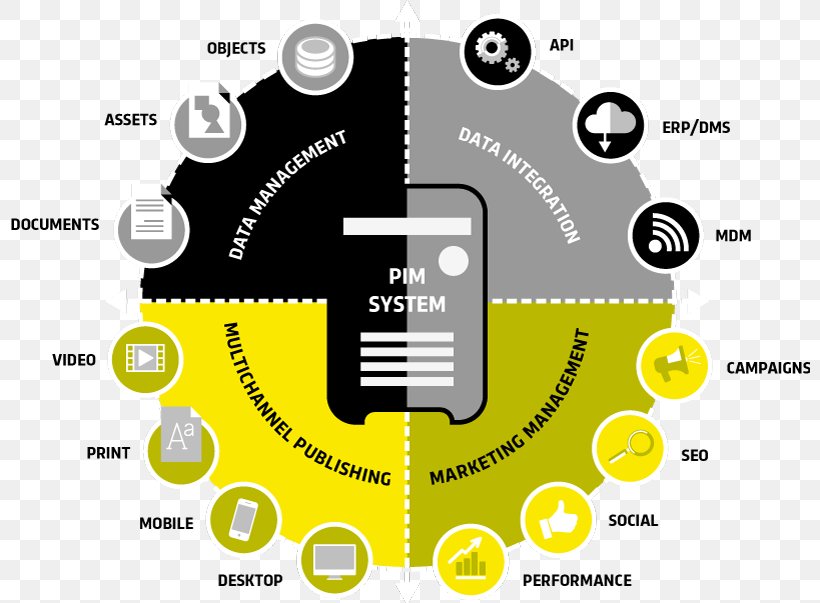
A circular diagram that represents the PIM system, which is a system that helps businesses manage their data. The diagram is divided into six sections, each representing a different aspect of the system. The first section is labeled "Data Management" and is surrounded by various icons representing different aspects of data management, such as "Data Integration", "Multichannel Publishing", "Marketing Management", and "PIM System". These icons represent different types of data that can be used in the system, including data integration, data management tools, and marketing management tools. The second section is titled "Data integration", which is represented by a gray rectangular box with a white label that reads "Pim System". There are also several smaller icons scattered throughout the diagram, including a magnifying glass, a book, a document, a graph, and a magnifier, which represent the various tools and features that the system can use to manage and analyze data. These icons are connected by arrows, indicating that they are connected to each other and are meant to represent the flow of data from one aspect to another.
Product Information Management Pimcore Database Digital Asset Management Enterprise Resource Planning PNG
. The resolution of this PNG file is 800 x 603 pixels and it has a file size of 84.67 KB.A circular diagram that represents the PIM system, which is a system that helps businesses manage their data. The diagram is divided into six sections, each representing a different aspect of the system. The first section is labeled "Data Management" and is surrounded by various icons representing different aspects of data management, such as "Data Integration", "Multichannel Publishing", "Marketing Management", and "PIM System". These icons represent different types of data that can be used in the system, including data integration, data management tools, and marketing management tools. The second section is titled "Data integration", which is represented by a gray rectangular box with a white label that reads "Pim System". There are also several smaller icons scattered throughout the diagram, including a magnifying glass, a book, a document, a graph, and a magnifier, which represent the various tools and features that the system can use to manage and analyze data. These icons are connected by arrows, indicating that they are connected to each other and are meant to represent the flow of data from one aspect to another.
Product Information Management Pimcore Database Digital Asset Management Enterprise Resource Planning PNG
Related PNG Images