Save
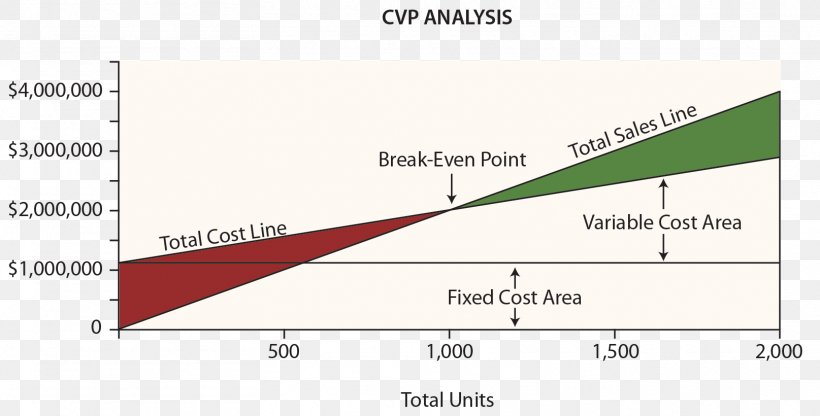
User morajonas uploaded this Line - Cost–volume–profit Analysis Chart Graph Of A Function Break-even PNG PNG image on February 28, 2018, 1:28 pm. The resolution of this file is 1615x820px and its file size is: 74.99 KB. This PNG image is filed under the tags:
Line - Cost–volume–profit Analysis Chart Graph Of A Function Break-even PNG
Below are more related PNG images...