User wawapunya uploaded the image
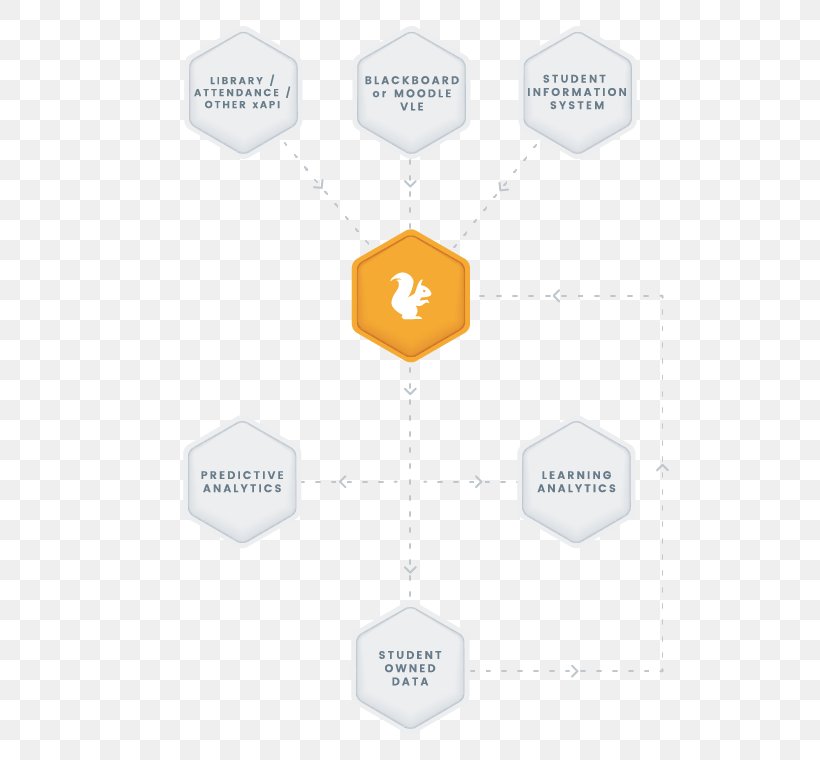
A flowchart that represents the process of learning analytics. It consists of six hexagons connected by arrows, each representing a different step in the process. The first hexagon is labeled "Library / Attendance / Other XAPI" and has a label that reads "Blackboard or Moodle VLE". The second hexagon has an orange hexagon with a white silhouette of a bird on it. The third hexagon represents "Student Information System". The fourth hexagon contains "Predictive Analytics" and the fifth hexagon shows "Learning Analytics". At the bottom of the flowchart, there is a label with the text "Student Owned Data". This indicates that the process involves analyzing and analyzing data from a library or other XAPI platform. Overall, the image represents the various steps involved in learning analytics and how they interact with each other.
Ecosystem Brand Product Design Learning PNG
. The resolution of this PNG file is 622 x 760 pixels and it has a file size of 25.25 KB.A flowchart that represents the process of learning analytics. It consists of six hexagons connected by arrows, each representing a different step in the process. The first hexagon is labeled "Library / Attendance / Other XAPI" and has a label that reads "Blackboard or Moodle VLE". The second hexagon has an orange hexagon with a white silhouette of a bird on it. The third hexagon represents "Student Information System". The fourth hexagon contains "Predictive Analytics" and the fifth hexagon shows "Learning Analytics". At the bottom of the flowchart, there is a label with the text "Student Owned Data". This indicates that the process involves analyzing and analyzing data from a library or other XAPI platform. Overall, the image represents the various steps involved in learning analytics and how they interact with each other.
Related PNG Images