User luisibarra22 uploaded the image
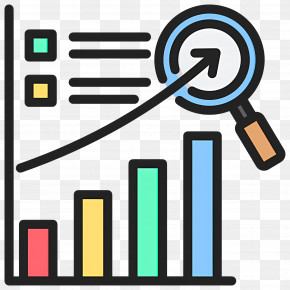
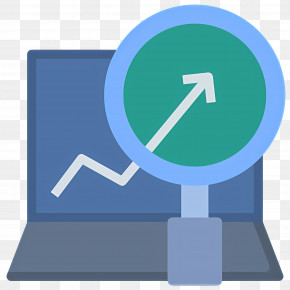
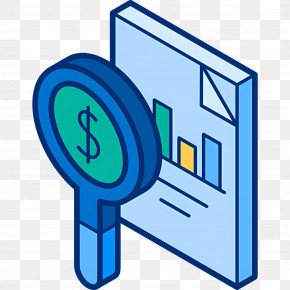
An illustration of a computer monitor with a bar graph on the screen. The bar graph is composed of four bars of different colors - red, yellow, green, blue, and gray. The bars are arranged in a horizontal line, with the red bar at the top, the yellow bar in the middle, and the green bar on the bottom. Above the bar graph, there is a magnifying glass with an arrow pointing upwards.
Investment Research - Business Growth Analytics On Screen PNG
. The resolution of this PNG file is 2048 x 2048 pixels and it has a file size of 980.15 KB.An illustration of a computer monitor with a bar graph on the screen. The bar graph is composed of four bars of different colors - red, yellow, green, blue, and gray. The bars are arranged in a horizontal line, with the red bar at the top, the yellow bar in the middle, and the green bar on the bottom. Above the bar graph, there is a magnifying glass with an arrow pointing upwards.
Investment Research - Business Growth Analytics On Screen PNG
Related PNG Images