User qsqsqwwed uploaded the image
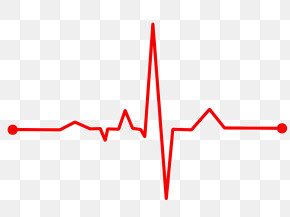
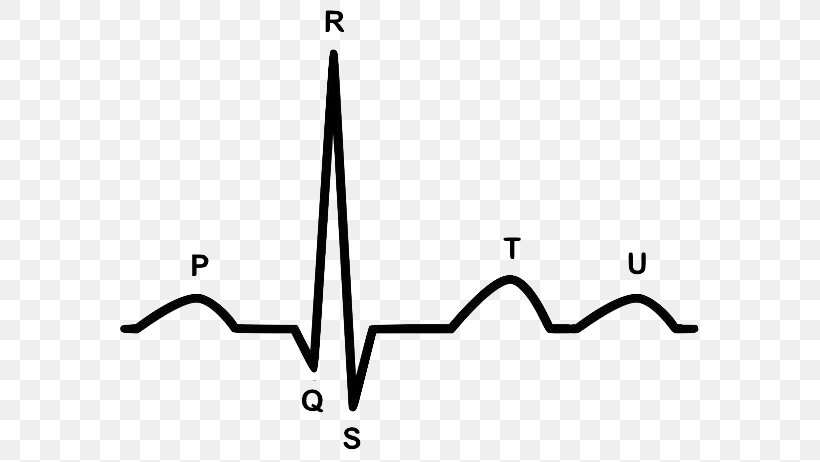
A black and white line drawing of an ECG (Electrocardiogram) pulse. The ECG is a continuous line that represents the electrical activity of a person's heart. The line is made up of multiple points, each representing a different stage of the ECG. The points are arranged in a vertical line, with the top point being the largest and the bottom two points being the smallest. The lines intersect at various points, creating a wave-like pattern. simple and minimalistic, with no additional details or shading.
Electrocardiography Heart Arrhythmia Cardiology Cardiovascular Disease PNG
. The resolution of this PNG file is 605 x 462 pixels and it has a file size of 32.26 KB.A black and white line drawing of an ECG (Electrocardiogram) pulse. The ECG is a continuous line that represents the electrical activity of a person's heart. The line is made up of multiple points, each representing a different stage of the ECG. The points are arranged in a vertical line, with the top point being the largest and the bottom two points being the smallest. The lines intersect at various points, creating a wave-like pattern. simple and minimalistic, with no additional details or shading.
Electrocardiography Heart Arrhythmia Cardiology Cardiovascular Disease PNG
Related PNG Images