User Krronic uploaded the image
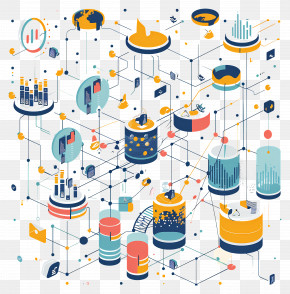
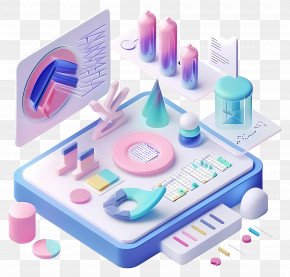
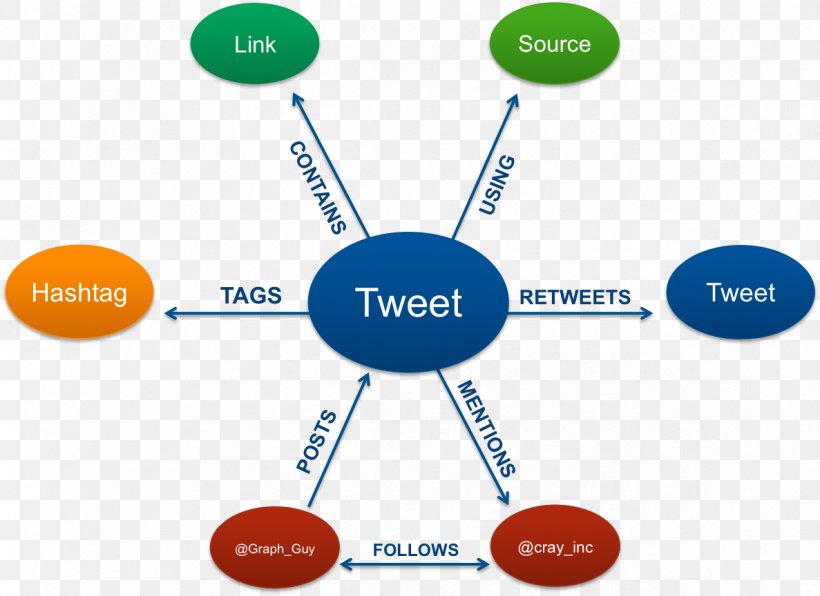
A circular diagram that represents the relationship between Twitter and other social media platforms. The diagram is divided into six sections, each representing a different aspect of Twitter. The first section is labeled "Link", the second section is titled "Source", the third section is labelled "Hashtag", the fourth section is numbered "TAGS", the fifth section is colored orange, the sixth section is blue, the seventh section is green, the eighth section is yellow, the ninth section is red, the tenth section is orange, and the eleventh section is purple. There are also several arrows connecting the different elements of Twitter, such as links, source, tags, retweets, and tweets. These elements are connected by lines, indicating that they are connected to each other. The arrows represent the flow of information between the elements, from links to sources, and how they interact with each other in a specific way.
Graph Database Analysis Big Data PNG
. The resolution of this PNG file is 1187 x 864 pixels and it has a file size of 228.83 KB.A circular diagram that represents the relationship between Twitter and other social media platforms. The diagram is divided into six sections, each representing a different aspect of Twitter. The first section is labeled "Link", the second section is titled "Source", the third section is labelled "Hashtag", the fourth section is numbered "TAGS", the fifth section is colored orange, the sixth section is blue, the seventh section is green, the eighth section is yellow, the ninth section is red, the tenth section is orange, and the eleventh section is purple. There are also several arrows connecting the different elements of Twitter, such as links, source, tags, retweets, and tweets. These elements are connected by lines, indicating that they are connected to each other. The arrows represent the flow of information between the elements, from links to sources, and how they interact with each other in a specific way.
Related PNG Images