Save
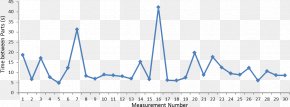
User KOTMACIEK uploaded this GRAF - Graph Of A Function Cycle Time Variation Diagram Lean Manufacturing Turnaround Time PNG PNG image on December 12, 2018, 1:47 pm. The resolution of this file is 1486x1117px and its file size is: 23.73 KB. This PNG image is filed under the tags:
GRAF - Graph Of A Function Cycle Time Variation Diagram Lean Manufacturing Turnaround Time PNG
Below are more related PNG images...