User iPredictible uploaded the image
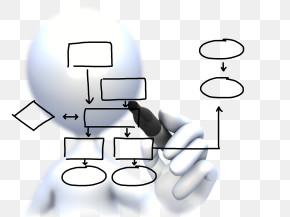
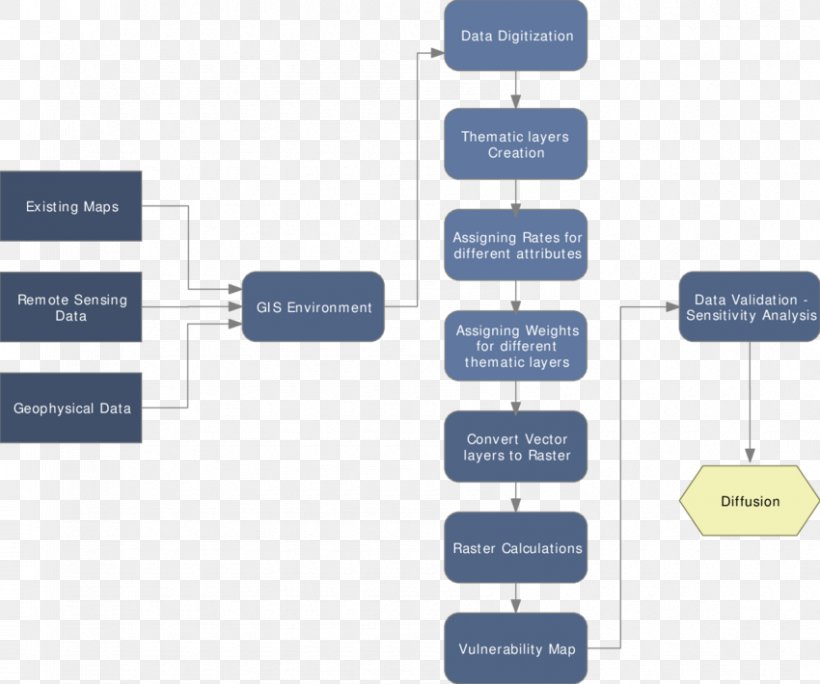
A flowchart that represents the process of data digitization and data validation. It consists of several boxes connected by arrows, each box representing a different step in the process. The first box represents existing maps, the second box represents remote sensing data, and the third box represents geophysical data. The first box is labeled "GIS Environment" and represents the GIS environment. The second box is titled "Thematic layers creation". The third box is labelled "Assigning rates for different attributes". The fourth box is called "Data Validation - Sensitivity Analysis". The fifth box is described as "Convert Vector layers to Raster". The sixth box has labeled "Raster Calculations" and the seventh box has labelled "Vulnerability Map". Overall, the flowchart is a visual representation of the process and how it works.
Flowchart Technology PNG
. The resolution of this PNG file is 850 x 710 pixels and it has a file size of 81.18 KB.A flowchart that represents the process of data digitization and data validation. It consists of several boxes connected by arrows, each box representing a different step in the process. The first box represents existing maps, the second box represents remote sensing data, and the third box represents geophysical data. The first box is labeled "GIS Environment" and represents the GIS environment. The second box is titled "Thematic layers creation". The third box is labelled "Assigning rates for different attributes". The fourth box is called "Data Validation - Sensitivity Analysis". The fifth box is described as "Convert Vector layers to Raster". The sixth box has labeled "Raster Calculations" and the seventh box has labelled "Vulnerability Map". Overall, the flowchart is a visual representation of the process and how it works.
Related PNG Images