Save
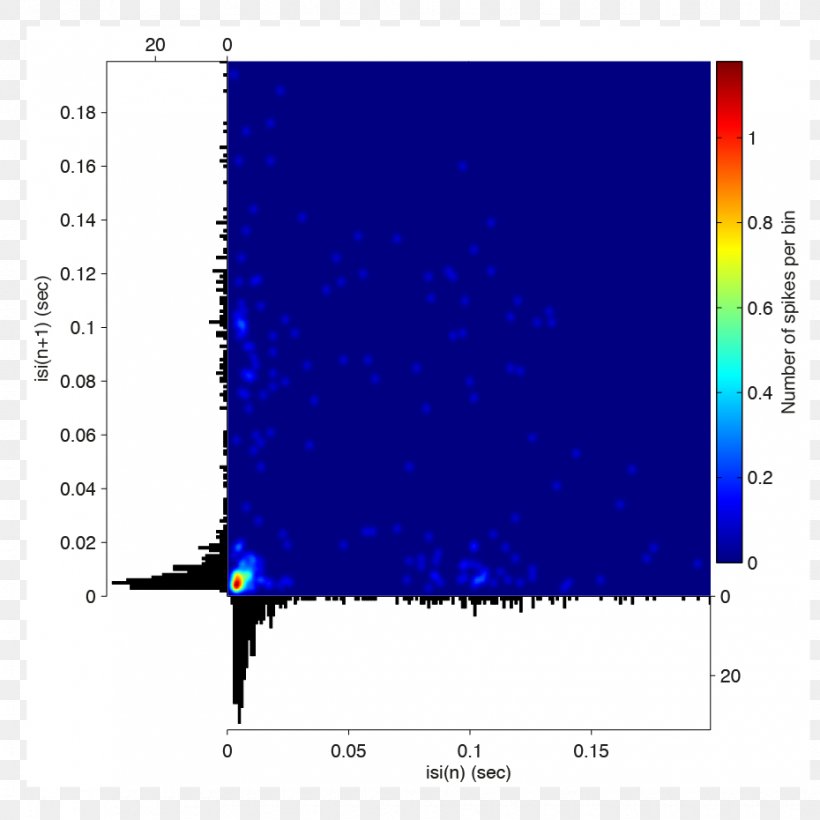
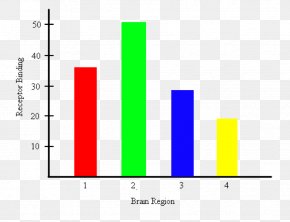
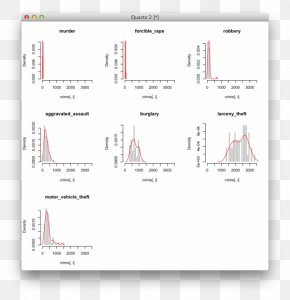
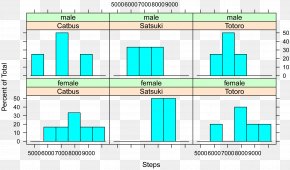
User patsywap47 uploaded this Data Preprocessing - Peristimulus Time Histogram Chart Plot MATLAB PNG PNG image on February 2, 2019, 2:09 am. The resolution of this file is 930x930px and its file size is: 71.80 KB. This PNG image is filed under the tags:
Data Preprocessing - Peristimulus Time Histogram Chart Plot MATLAB PNG
Below are more related PNG images...