User likeablelunatic29 uploaded the image
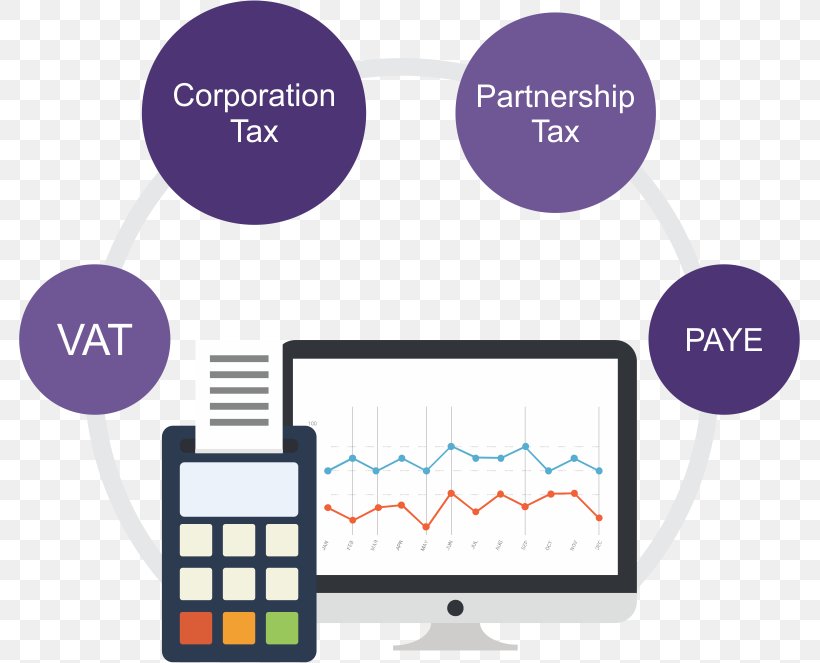
The image shows a computer monitor with a graph on the screen and a calculator next to it. The graph is a line graph that shows the relationship between corporation tax, partnership tax, VAT, and paye. There are three purple circles around the monitor, each representing a different aspect of the relationship. The circles are labeled "Corporation Tax", "Partnership Tax", and "Paye".
Income Tax Accounting Business Computing PNG
. The resolution of this PNG file is 781 x 663 pixels and it has a file size of 65.52 KB.The image shows a computer monitor with a graph on the screen and a calculator next to it. The graph is a line graph that shows the relationship between corporation tax, partnership tax, VAT, and paye. There are three purple circles around the monitor, each representing a different aspect of the relationship. The circles are labeled "Corporation Tax", "Partnership Tax", and "Paye".
Related PNG Images