User Kofphtastrophe uploaded the image
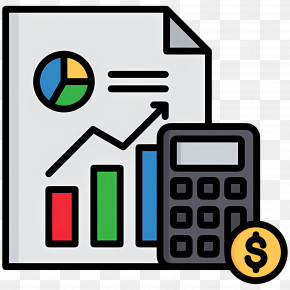
An illustration of a calculator and a document with a dollar sign on it. The document appears to be a financial report or a financial statement, with a bar graph on the left side of the image. The bar graph is red and shows a steady increase in value over time. The calculator is blue with a yellow button on the right side.
Budget And Finance - Calculator And Graph For Financial Data Analysis PNG
. The resolution of this PNG file is 2048 x 2048 pixels and it has a file size of 1.13 MB.An illustration of a calculator and a document with a dollar sign on it. The document appears to be a financial report or a financial statement, with a bar graph on the left side of the image. The bar graph is red and shows a steady increase in value over time. The calculator is blue with a yellow button on the right side.
Budget And Finance - Calculator And Graph For Financial Data Analysis PNG
Related PNG Images