User waterg uploaded the image
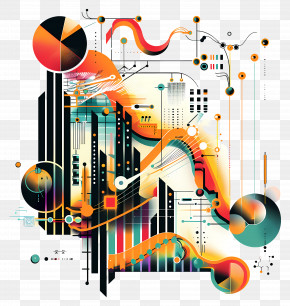
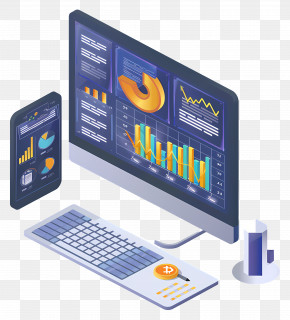
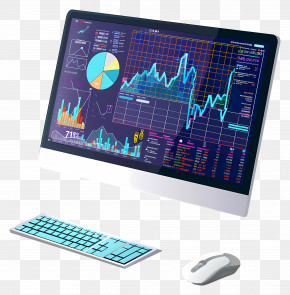
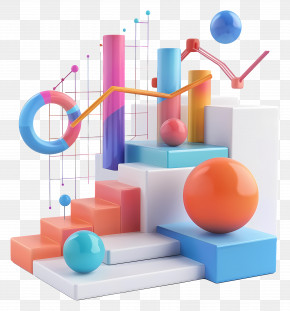
An isometric illustration of various electronic devices and objects related to data analysis. In the center of the image, there is a large computer monitor with a colorful graph on the screen. The graph is divided into different sections, each representing a different aspect of data analysis, such as graphs, charts, and graphs. On the right side of the monitor, there are two smaller devices, one with a pie chart and the other with a bar graph. The devices are connected to each other by a series of lines and dots, representing the data analysis process. - There are also several icons scattered around the devices, including a magnifying glass, a gear, and a graph bar. The overall color scheme of the illustration is vibrant and colorful, with a mix of blues, greens, and yellows.
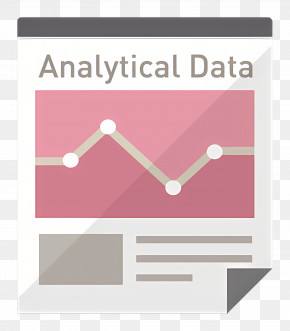
Analytical Data - Colorful Data Visualization Elements PNG
. The resolution of this PNG file is 4084 x 4264 pixels and it has a file size of 11.45 MB.An isometric illustration of various electronic devices and objects related to data analysis. In the center of the image, there is a large computer monitor with a colorful graph on the screen. The graph is divided into different sections, each representing a different aspect of data analysis, such as graphs, charts, and graphs. On the right side of the monitor, there are two smaller devices, one with a pie chart and the other with a bar graph. The devices are connected to each other by a series of lines and dots, representing the data analysis process. - There are also several icons scattered around the devices, including a magnifying glass, a gear, and a graph bar. The overall color scheme of the illustration is vibrant and colorful, with a mix of blues, greens, and yellows.
Analytical Data - Colorful Data Visualization Elements PNG
Related PNG Images