User chelabellss uploaded the image
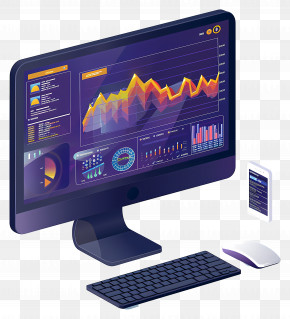
A screenshot of a computer monitor displaying a dashboard with various graphs and charts. The dashboard is titled "By Region" and has a world map on the right side. On the left side of the dashboard, there is a pie chart that shows the percentage of visitors by region. The pie chart is divided into different sections, each representing a different region. At the bottom of the screen, there are several bar graphs in different colors, including green, orange, yellow, and red. The bars are arranged in a horizontal line, with the largest bar at the bottom and the smallest at the top. The largest bar is labeled "By Customer" and shows that the majority of visitors are by region, while the smallest bar is colored in orange. Overall, the dashboard appears to be a visual representation of the data collected by a company or organization.
Dashboard Business Intelligence Report Analytics PNG
. The resolution of this PNG file is 531 x 493 pixels and it has a file size of 16.22 KB.A screenshot of a computer monitor displaying a dashboard with various graphs and charts. The dashboard is titled "By Region" and has a world map on the right side. On the left side of the dashboard, there is a pie chart that shows the percentage of visitors by region. The pie chart is divided into different sections, each representing a different region. At the bottom of the screen, there are several bar graphs in different colors, including green, orange, yellow, and red. The bars are arranged in a horizontal line, with the largest bar at the bottom and the smallest at the top. The largest bar is labeled "By Customer" and shows that the majority of visitors are by region, while the smallest bar is colored in orange. Overall, the dashboard appears to be a visual representation of the data collected by a company or organization.
Related PNG Images